The formatter
SenHub provides information in a standard json format that everybody can use as wanted. In this way, access to measurements is standardized, regardless of the data source. Each "aaS" provider has its own API format, its own units of measurement. These are all difficulties and complications each time you have to integrate a new provider. SenHub can also return the information directly in the native format of several well-known tools on the market (PRTG, Nagios, ... check your instance details for the full list) to make integrating this data into your monitoring tool easier. By offering an endpoint whose response is perfectly adapted, there is almost no configuration for you to do. That's the role of the formatter.
SenHub's raw format
SenHub raw format is a standard JSON output. It always returns its payload like this: * metrics: the relevant metrics associated to your resource * message: a text message that tells you if the collection was successful or not * date: timestamp of the collection
Here is an example:
{
  "metrics": [
    {
      "channel": "daysRemaining",
      "value": 55
    },
    {
      "channel": "validTo",
      "value": "2021-10-04T05:16:11.000Z"
    }
  ],
  "message": "Metrics successfully retrieved.",
  "date": 1628586810273
}
PRTG's format
PRTG output looks like this:
{
  "prtg": {
    "result": [
      {
        "channel": "daysRemaining",
        "value": 55
      }
    ],
    "text": "validTo: 2021-10-04T05:16:11.000Z"
  }
}
Nagios's format
Nagios output looks like this:
We provide you as well the tiny script for your Nagios (download from our public github repository). Just copy this file in the /usr/local/nagios/libexec/ directory and make it executable. Afterwards, you have to define the new command (you can make it in the GUI for Nagios XI users, or by editing the /usr/local/nagios/etc/objects/commands.cfg file) with one argument (\$ARG1$). Then you just need to assign the previous command as a service for a specific host, and paste into the \$ARG1$ field your instance endpoint. This Nagios output is performance data compliant.Centreon's format
Centreon output looks like this:
We've also provided a Perl script for your Centreon platform (Enterprise or Community edition); download it from our public GitHub repository.Simply copy this file into the /usr/lib/centreon/plugins/ directory and make it executable. Next, you need to define the new command via the GUI with an argument ($ARG1$).
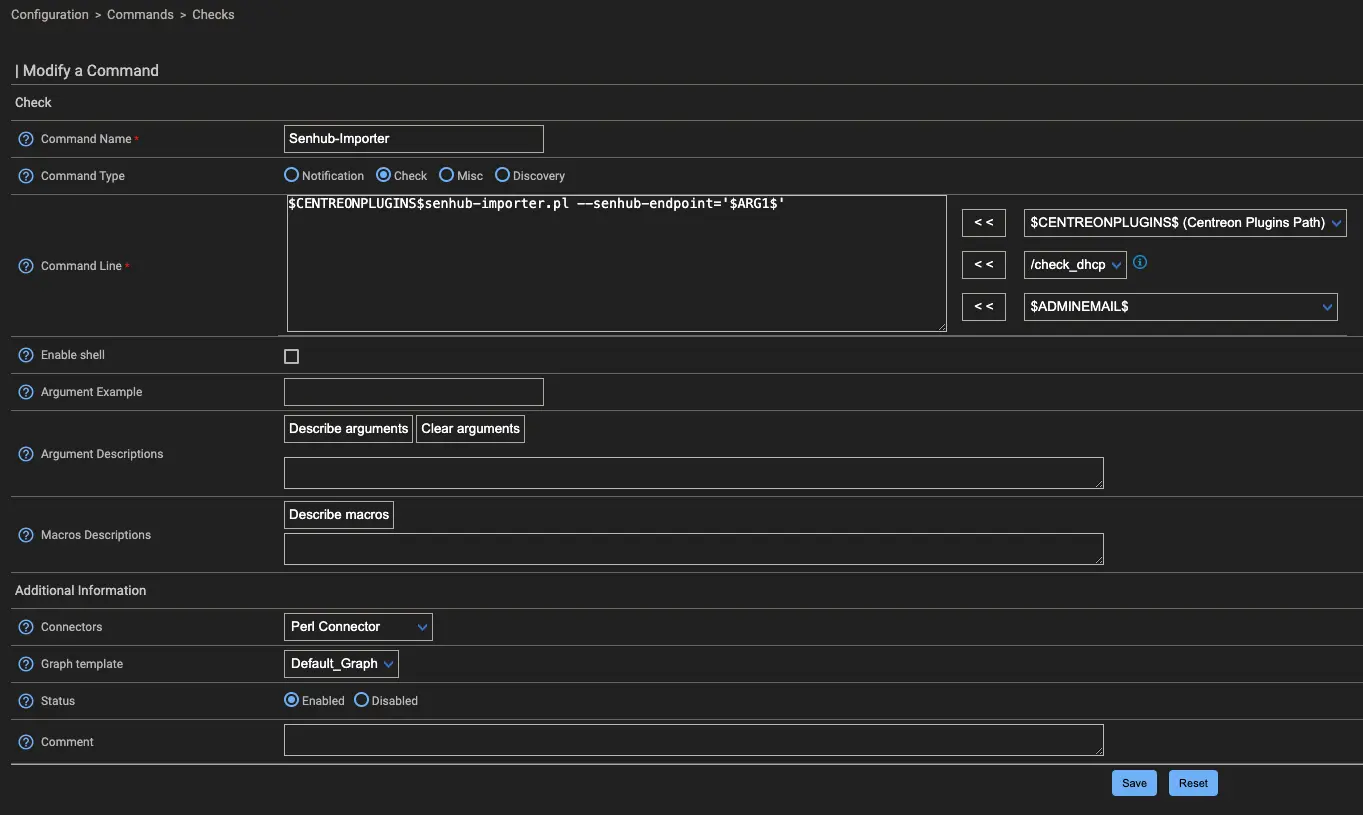
Then you just need to assign the previous command as a service for a specific host, and paste into the \$ARG1$ field your instance endpoint.
This Centreon output conforms to the performance data.
Prometheus's format
Prometheus output looks like this:
SenHub acts as a node exporter, so you just have to add a scrape target to your Prometheus configuration.Note: this configuration is done on the Prometheus server.
Step 1: log in to the Prometheus server and open the prometheus.yml file.
Step 2: under the scrape config section, add a new job pointing at your instance endpoint, as shown below. The job name can be anything you like for identification purposes.
- job_name: 'node_exporter_metrics'
  scrape_interval: 300s
  static_configs:
    - targets: ['<your instance endpoint>']
Step 3: restart the Prometheus service for the configuration changes to take effect.
Zabbix's format
Zabbix integration is particularly seamless. Output looks like this:
{
  "__template_url__": "https://api.senhub.io/sensors/instances/3b6a7357-3e02-4592-8611-b0e5122590be/zabbix_template",
  "daysremaining": 390,
  "validto": "2023-10-22T23:59:59.000Z",
  "error": 0
}
In the output in Zabbix format, we find not only the metrics but also a link to a host file that you just have to import in your configuration. This link is located in the entry named: __template_url__
This file is updated at each instance request. So if new metrics appear or disappear, the host file is always an exact reflection of the content of the metrics. It can be used to update your host configuration by re-importing it into your Zabbix platform.
Nothing more to do: your Zabbix platform is prepared to collect the metrics with the units if they are available!
Here is a partial example of a host file generated by the SenHub:
{
-   zabbix_export:
    {
    -   version: "7.0",
    -   date: "2022-09-27T14:58:40Z",
    -   host_groups:
        [
        -   {
            -   uuid: "0861ae23cfeb4314809842fbbb3258d8",
            -   name: "SenHub"
            }
        ],
    -   hosts:
        [
        -   {
            -   host: "wwwsensorfactoryeu",
            -   name: "wwwsensorfactoryeu",
            -   groups:
                [
                -   {
                    -   name: "SenHub"
    .....
}
SenHub is compatible with Zabbix 5.0 and later.