Explore

New Relic connector: uptime, trends and monitoring that never sleeps

By Matthieu Noirbusson
3 August 2026 • 3 minutes read
Our New Relic connector brings your New Relic synthetic monitors into your monitoring tool — PRTG, Zabbix or any other platform: user journeys, response times, availability. It has just received a series of major upgrades. Three of them deserve a closer look: the Uptime mode, the trend indicators, and a complete rework of private location monitoring.
Uptime: the question your sensors could not answer
Your sensors could tell you whether the service is available right now. They could not answer the question your management or your customer asks: how available has this service been this month?
The new Uptime mode answers it directly: availability over rolling 24-hour, 7-day and 30-day windows, the number of failed checks and an estimated downtime over 30 days. In other words, your SLA figures, computed continuously, right inside your monitoring tool — no more rebuilding them by hand at the end of the month.
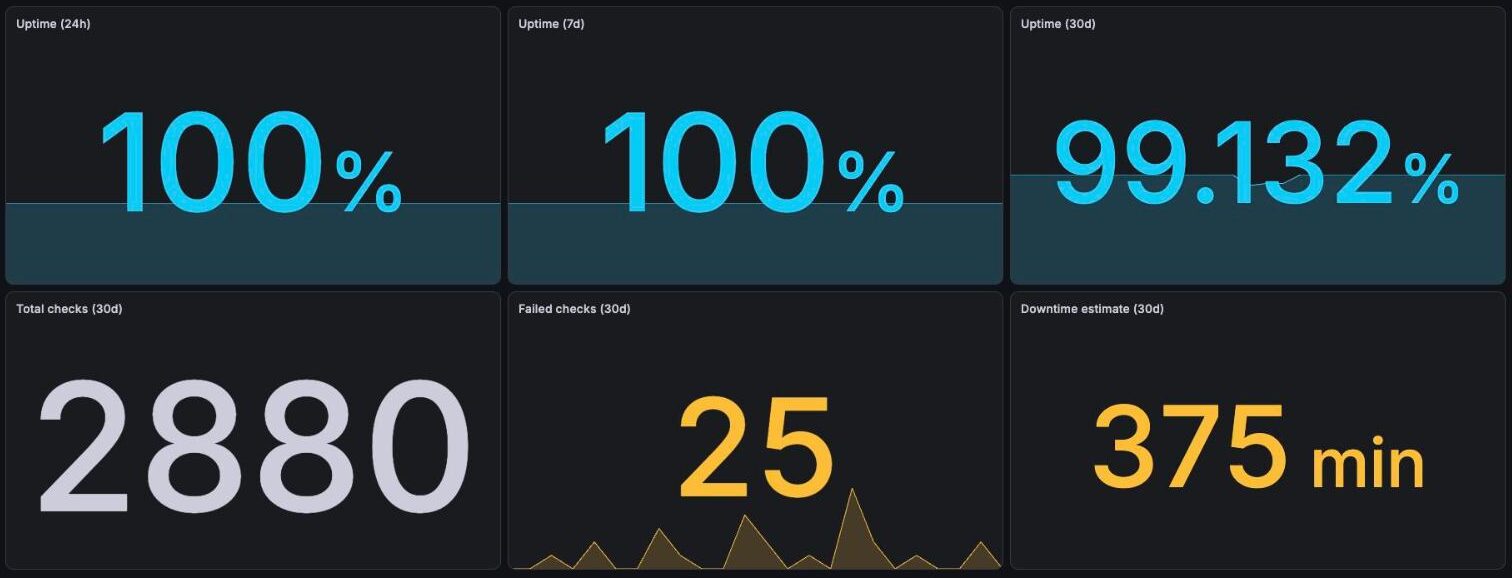
The Uptime mode, as seen from your sensors — based on real connector output.
Trend: comparing today against a baseline that makes sense
Comparing today’s performance with yesterday’s does not mean much: a Monday looks nothing like a Sunday. The Trend mode therefore compares today against the median of the last four identical weekdays — a Tuesday is compared to the four previous Tuesdays. This approach neutralises weekly seasonality and absorbs an isolated bad day.
For average duration, success rate and p95, you get today’s value, the baseline, and the delta. After a deployment, one glance is enough to know whether performance has regressed — or to confirm that an optimisation had the expected effect.
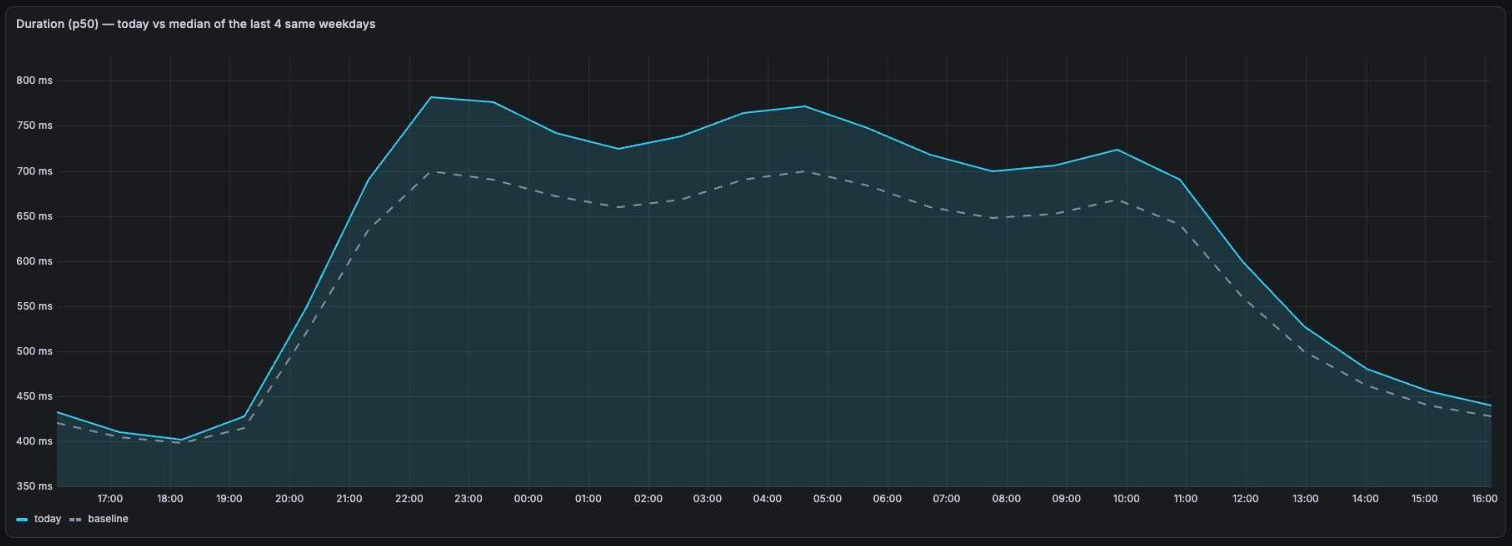
The median of the last 4 same weekdays neutralises seasonality.
Indicators built for alerting
Beyond the new modes, we enriched the existing metrics with one goal: every channel should be able to carry a useful threshold.
- Apdex and percentiles — the By Location mode now reports the Apdex, the standardised user-satisfaction index, over 24h, the satisfied / tolerating / frustrated breakdown, and the p50 to p99 percentiles. The p95 tells you what 95% of your users actually experience; a wide gap between p50 and p99 reveals unstable performance that an average would hide.
- Error channels that are always present — in Request Analysis, the HTTP 4xx and 5xx error counters and the global error rate are now emitted permanently, even at zero. You can set a permanent threshold on them, without waiting for a first error to make the channel appear.
- Watchdogs — the classic trap of API-based monitoring: when the source stops producing data, every metric keeps its last value and stays green. The new Last check age channel climbs instead, as soon as checks stop. Set a threshold at roughly three times your monitor’s check period, and you will never again be blind without knowing it.
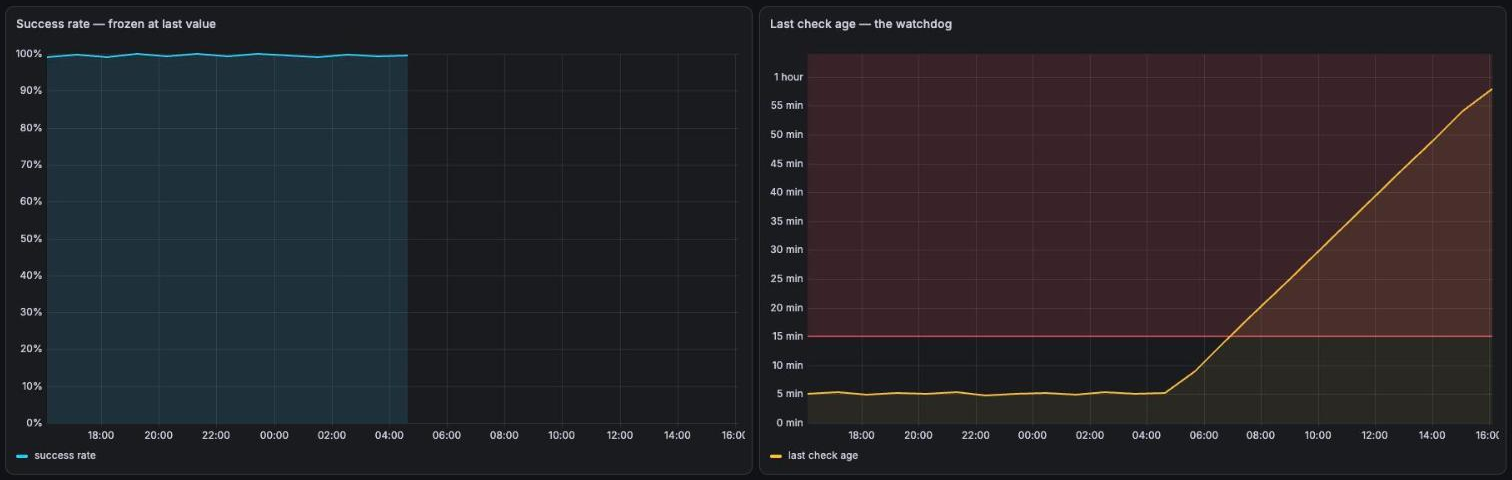
The frozen-metric trap — and the watchdog that defeats it.
Private locations: a forced rework, turned into an improvement
If you run your synthetic checks from your own infrastructure through New Relic private locations, important news: New Relic no longer publishes the host-level minion metrics (CPU, memory, workers). The old monitoring mode was silently becoming obsolete.
We fully rebuilt the Private Location mode around what really matters: the pending-check queue (a growing backlog means the location can no longer keep up), the job counters per runtime type, and a Status age channel — the same watchdog principle: a dead private location simply drops out of New Relic’s reporting; this channel climbs instead.
Seven angles of view
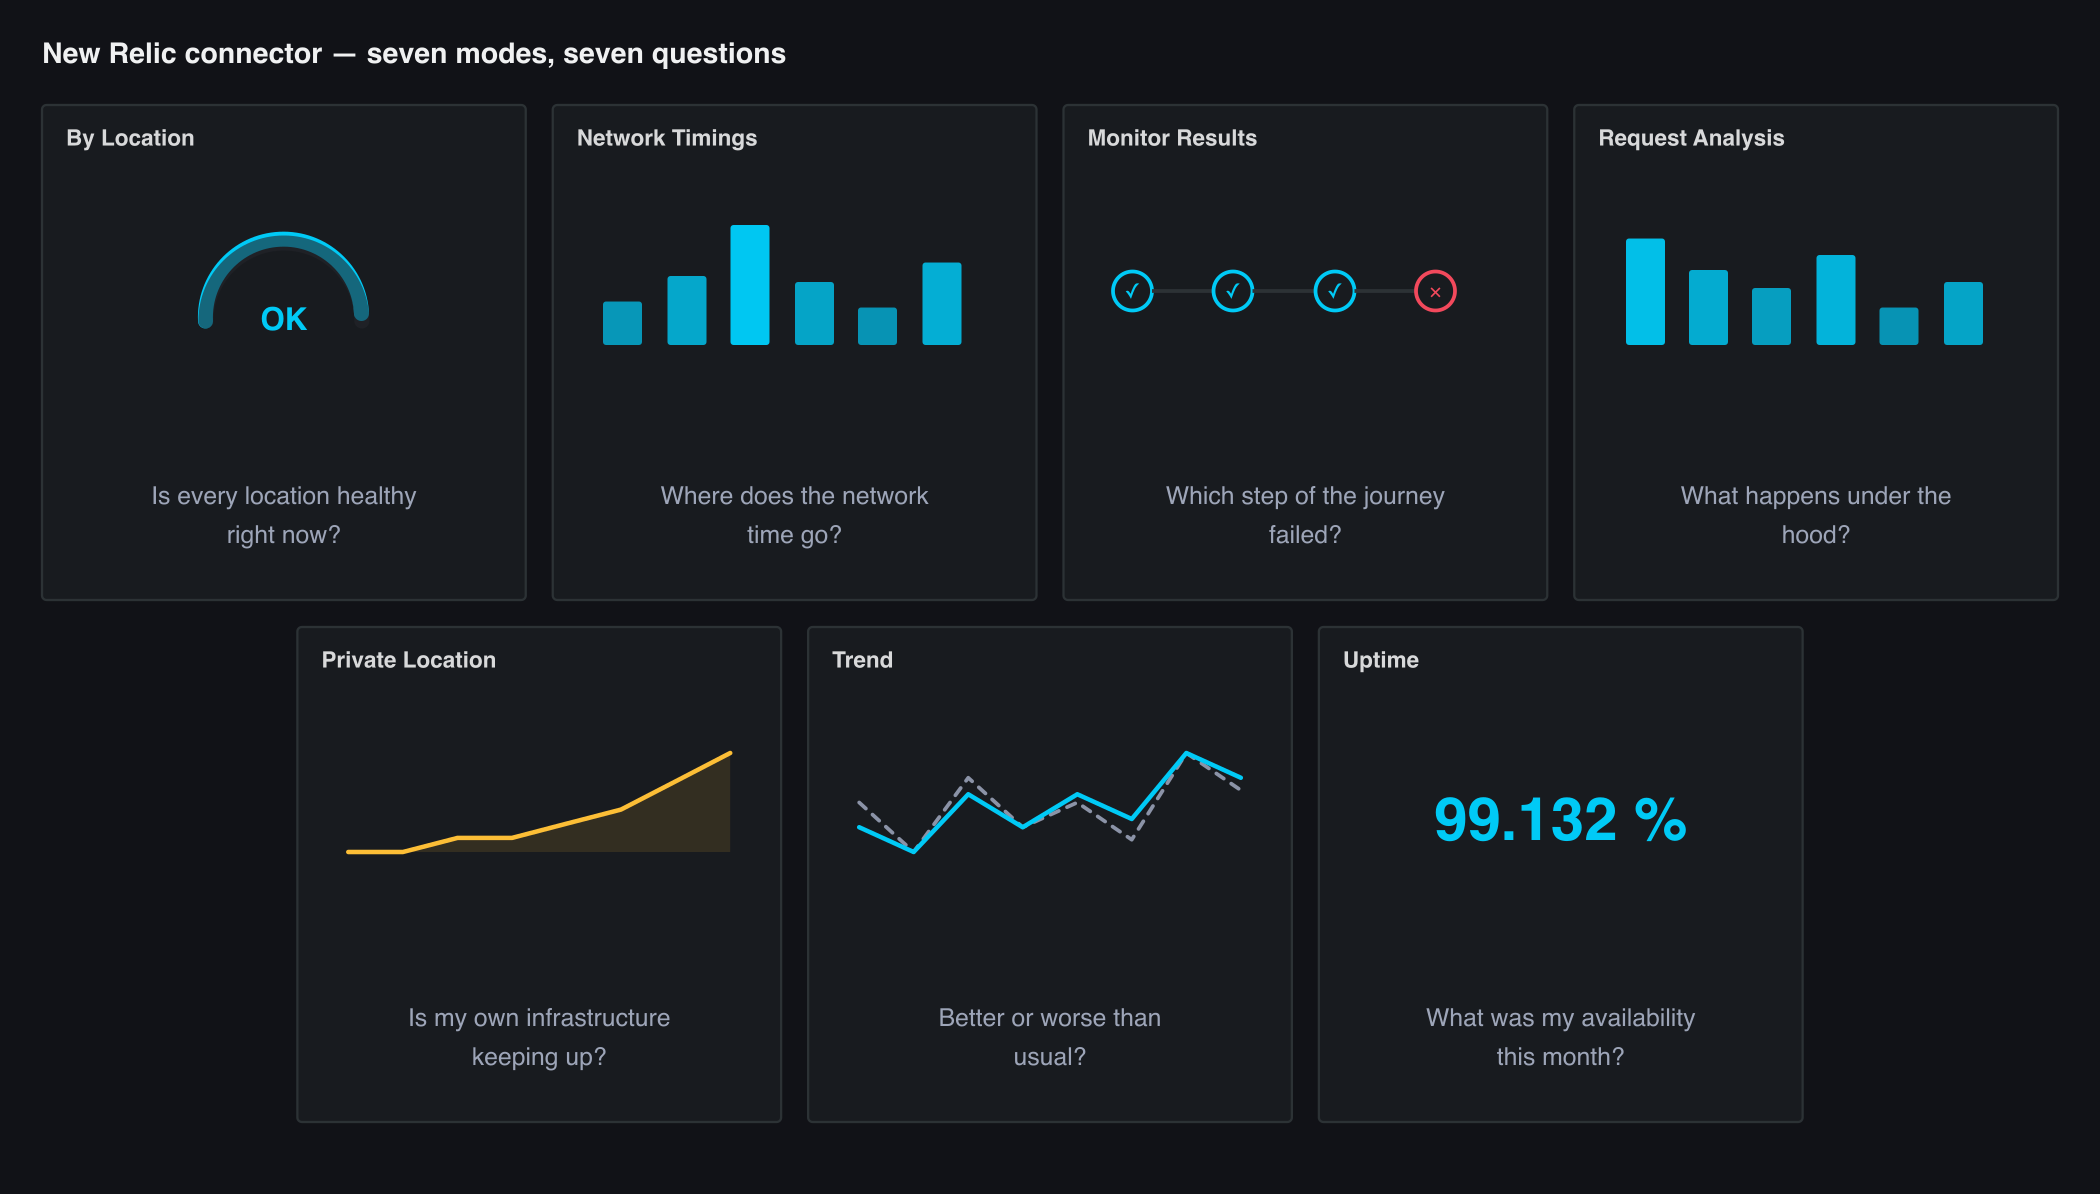
Seven representations, each answering one precise question.
The connector now offers seven representations, each answering one precise question: By Location (the global health view), Network Timings (where the network time goes), Monitor Results (every step of your scripted journeys, with the error message on failure), Request Analysis (the HTTP requests under the hood, third-party dependencies included), Private Location (the health of your execution infrastructure), Trend (the comparison against the baseline) and Uptime (your SLA figures).
The detailed documentation is available here: New Relic connector. While I am at it: it has been fully rebuilt on our new documentation platform — every mode is described with a table explaining what each metric tells you, and a real output sample.
These upgrades are available now for all accounts, with no action required on your existing sensors: the new modes simply appear in the list. Feel free to reach out with any question.
Newsletter
Senhub is constantly evolving. New connectors are available regularly. Keep up to date by subscribing to our newsletter.
Related articles
View all articles 








You can have a look at Senhub,
right now
A proof of concept is worth all the big explanations. You can try Senhub now, with no commitment.
Simply create your account (no credit card required) and start monitoring your cloud assets with your very own monitoring tool.
If you have any questions, send us an e-mail at contact@senhub.io or open our chat window to talk to one of our Senhub buddies.