Welcome to Zabbix users!

The integration of a new monitoring tool with Senhub is great news for us and open up possibilities to a whole community of IT Ops. And this community is not the least of them, since it is the Zabbix users.
Zabbix is an open source solution that is widely used by IT teams of large companies.
Zabbix provides a single, comprehensive view of the entire IT infrastructure. It is popular because it scales to any architecture, from smart home monitoring to multi-tenant enterprise systems. It offers large-scale monitoring, regardless of the complexity and scale of the IT infrastructure.
Two of its huge strengths are its ability to monitor large environments and its advanced automation capabilities.
Thanks to a collaborative work with our customer CDiscount, we have been able to develop not 1 but 2 formatters dedicated to Zabbix users and which allow to auto-configure Zabbix to integrate effortlessly all the metrics that Senhub provides thanks to its library of connectors available here.
Always a seamless integration
Senhub vocabulary point: a “formatter” is the Senhub function that formats monitoring data for a specific monitoring tool.
The formatter relies on the ability of Zabbix to parse JSON.
In order to interpret the data provided by Senhub, we create an item of type “HTTP Agent” in which we are going to program the request towards the endpoint of Senhub.
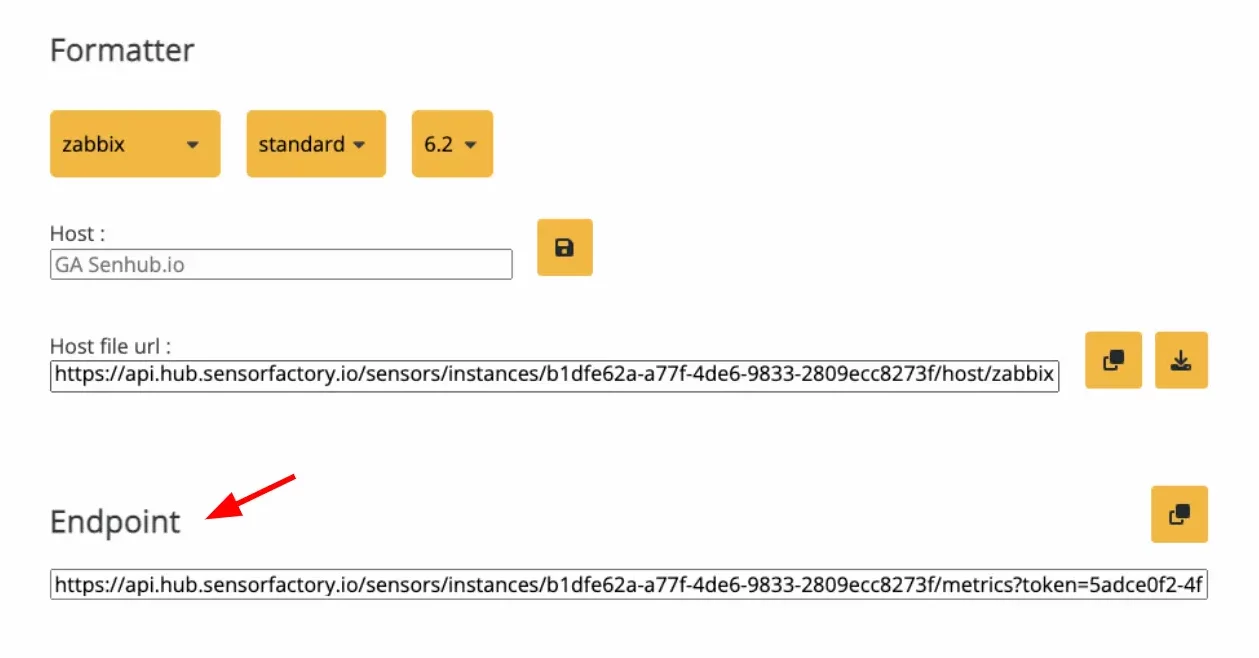
In the configuration of the Senhub instance, we find the endpoint to use
This endpoint is parsed in the configuration of the main item.
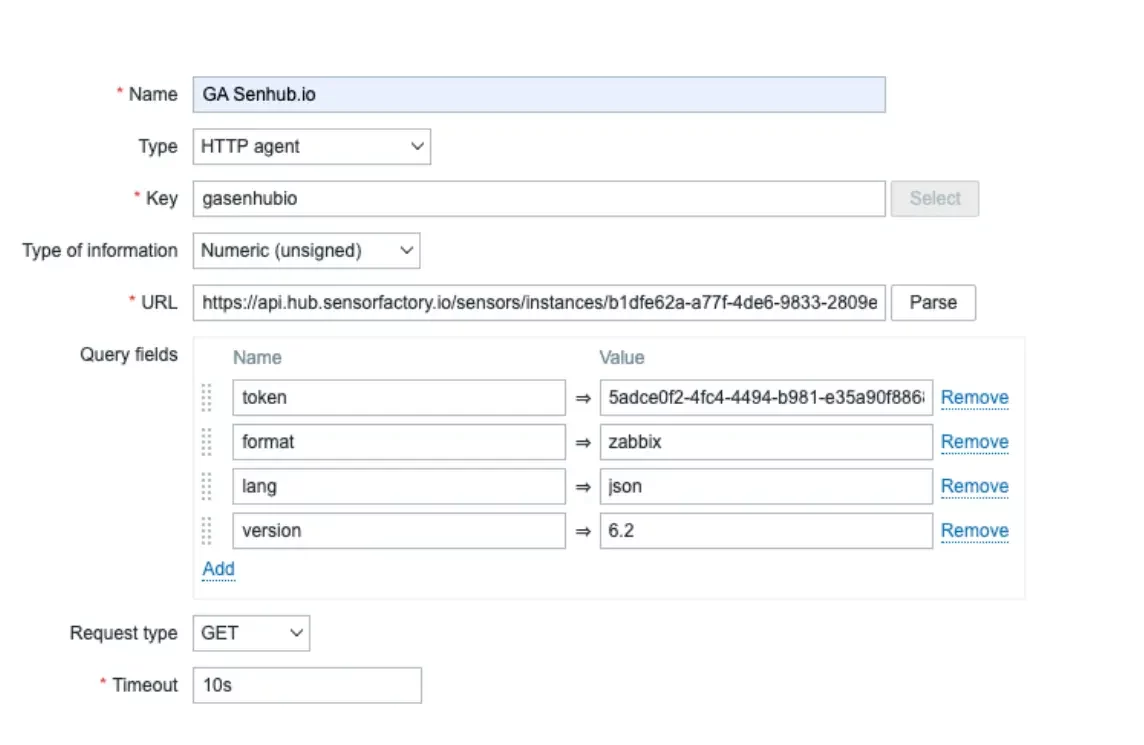
Detail of the item
In order to integrate the data for each metric provided by Senhub, we rely on “Dependent item” type items to parse the return of the main item.
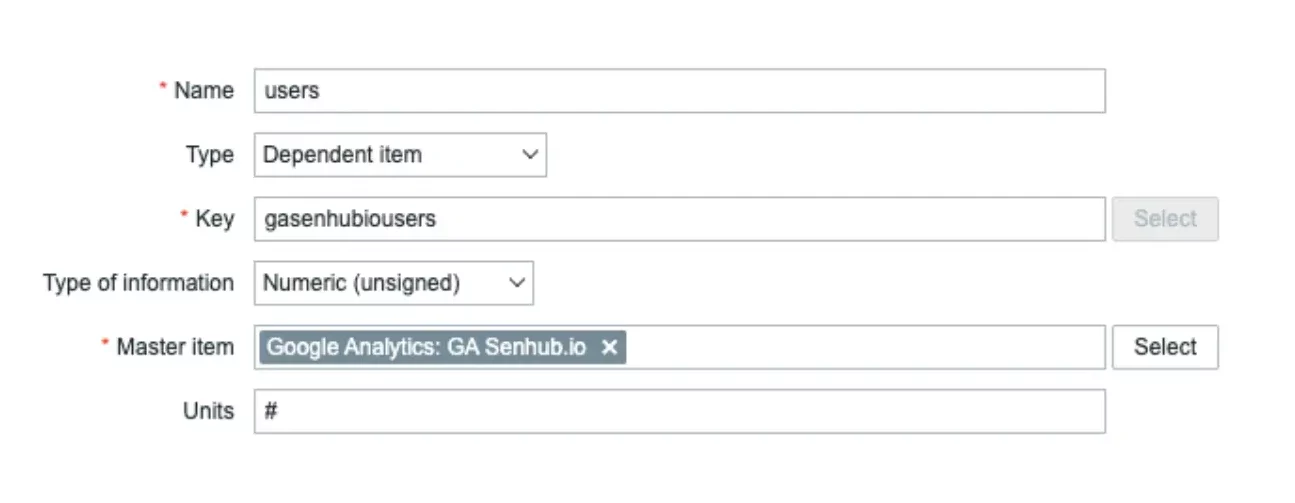
Example of a dependent item
You’re probably going to ask yourself, “but then I have to configure my platform to interpret every metric returned?”
Fortunately, you won’t have to!
It’s actually very simple, and mostly effortless.
Senhub generates a host configuration file for you containing the exact and complete description of the Zabbix configuration to interpret the Senhub returns.
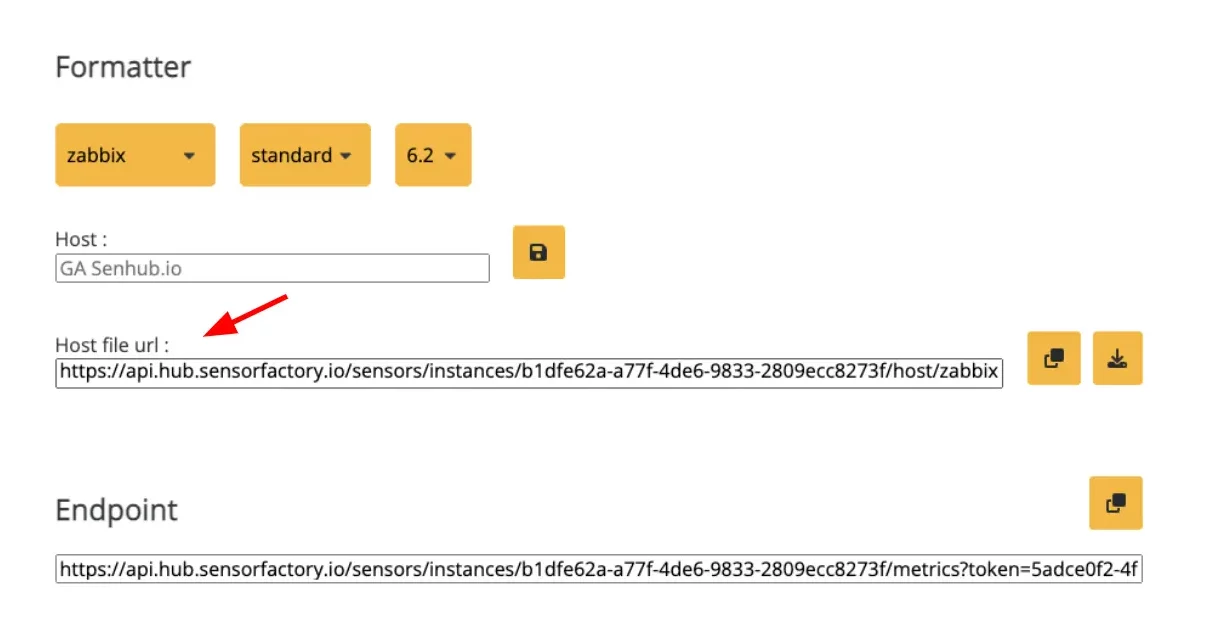
This file is to be imported into your Zabbix configuration and adds the host and the corresponding items to your supervision.
This step is a key moment in the procedure. Zabbix allows you to create the host, to update it and even to delete the items that are no longer present in the metrics returned by the Senhub.
This can happen if the Cloud provider has modified its APIs. We can then clean up its configuration by importing the updated host file.
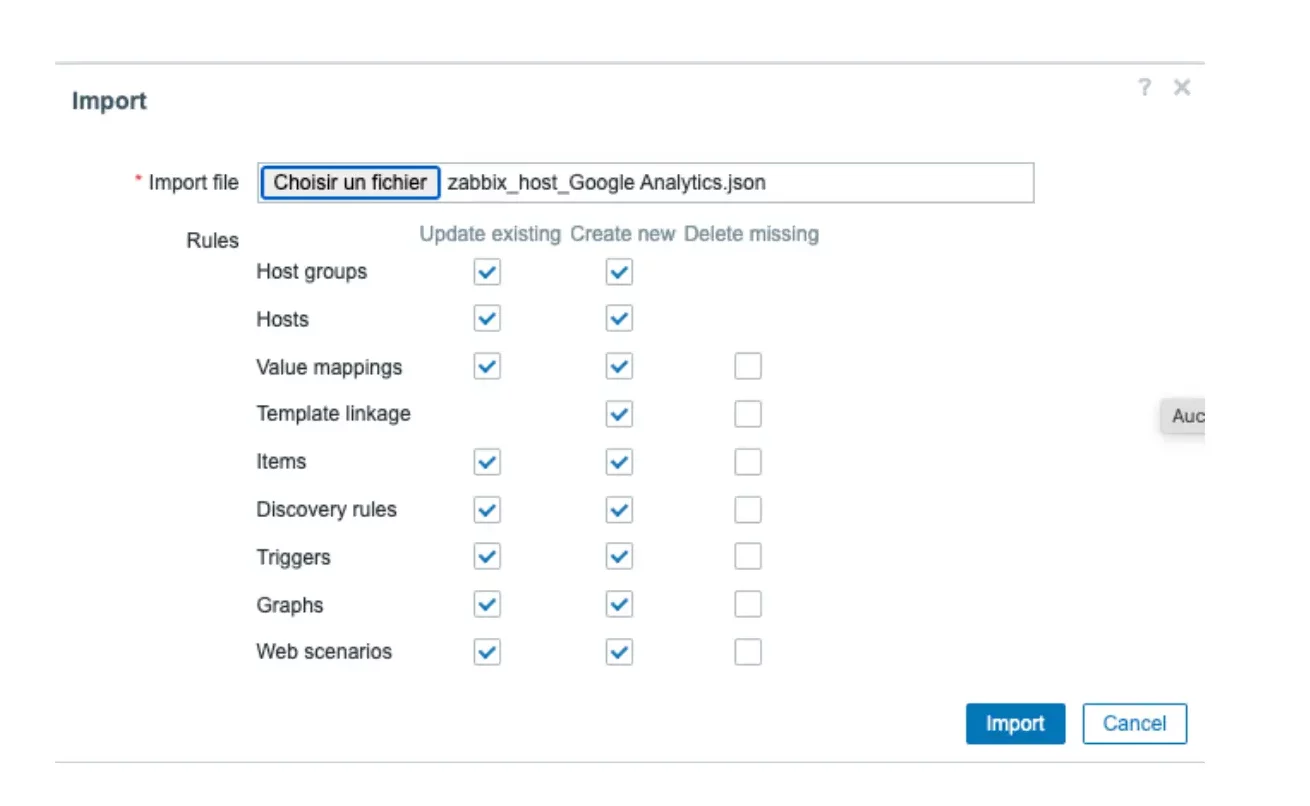
Choice of import mode

Zabbix configuration imported from Senhub
Why a host and not a template?
By definition, a template is a list of predefined checkpoints that we instantiate to monitor a specific host. However, Senhub retrieves the metrics of an already defined and identified resource, so it is not a template.
How do we proceed if we have several Senhub instances concerning the same host?
Good question! Indeed, you can have several Senhub instances for the same host if, for example, you consider the supervision of a series of micro-services all useful for the same application chain.
You may have noticed the Host field in the Formatter section.
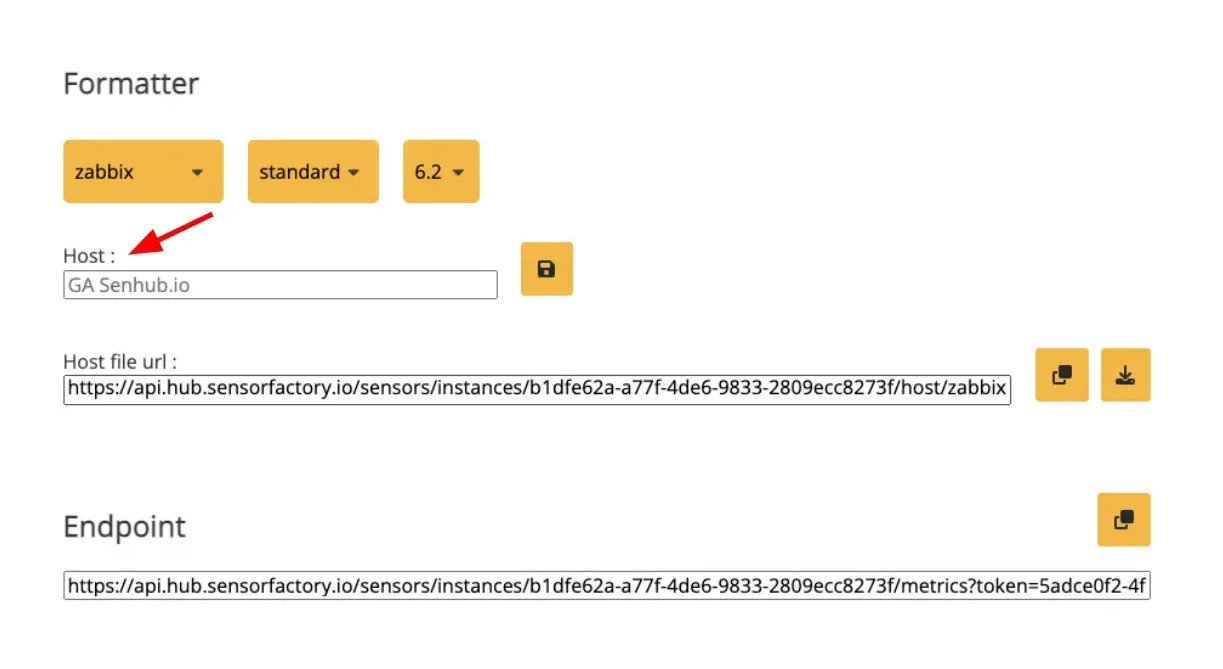
The field has the name of the instance by default
If you do not change it, the instance name is used for the host name in Zabbix. This leads to the creation of a host for each instance.
On the other hand, you can configure a host name here that will be the same for all instances you want. In this case, when importing, the host will be updated and the items corresponding to the Senhub instance added to those already configured. That’s it!
Standard or dynamic?
The way metrics are delivered is sometimes quite variable.
Generally speaking, the monitored objects have well-identified properties and metrics that vary little. The standard format is therefore perfectly adapted. If the definition of the metrics evolves, the host can be updated simply by re-importing the definition file provided by Senhub.
But other metrics are much more changing, especially when it is a key/value array. We discovered this need while working on the Azure Log Analytics connector.
Indeed, requests sometimes bring up a list that evolves according to the content of the logs. In this case, there was no question of updating the host file with each request!
We rely on the “discovery rule” function to allow Zabbix to create dependent items on demand.
The point is that it is necessary to use this format only when it makes sense. Indeed, the data in the table must be of the same nature and have the same unit.
[
  {
    "channel": "codes_4XX_reporting-api",
    "value": 12,
    "unit": "count"
  },
  {
    "channel": "codes_4XX_offer-management",
    "value": 23,
    "unit": "count"
  },
  {
    "channel": "codes_4XX_order-api",
    "value": 1,
    "unit": "count"
  },
  {
    "channel": "codes_4XX_order-management",
    "value": 63,
    "unit": "count"
  },
]
In summary
With this new formatter, Senhub joins the community of Zabbix enthusiasts!
It is possible to configure new checkpoints very quickly and effortlessly, and especially to choose the most suitable way to configure the metrics.
Senhub is compatible with all versions of Zabbix since version 5.2.
We encourage all Zabbix users to try Senhub with this new formatter and give us feedback. We have lots of ideas to enrich the solution and we would like to share them with you.
To join us it’s very simple: you can do it via our website or on our Discord here!
The Senhub in a few words
Created by IT monitoring experts for their customers, Senhub extends the capability of infrastructure monitoring tools by providing rich and powerful connectors to many cloud providers.
Learn more: https://senhub.io
Learn more about Zabbix: https://www.zabbix.com/
You can have a look at Senhub,
right now
A proof of concept is worth all the big explanations. You can try Senhub now, with no commitment.
Simply create your account (no credit card required) and start monitoring your cloud assets with your very own monitoring tool.
If you have any questions, send us an e-mail at contact@senhub.io or open our chat window to talk to one of our Senhub buddies.

