Explore
New connector: Azure Log Analytics

By Nicolas Jançon
31 January 2023 • 4 minutes read
This is how it is: the most difficult metrics to collect for an infrastructure monitoring tool are always hidden deep in the logs. Logs are good but there are millions or even billions of lines to analyze. Their structures are varied and require tools to analyze them on a large scale.
So cloud providers have found a solution by providing both structured data wells and a language to query them. This is the case of Azure with Azure Log Analytics which shares its query language: Kusto Query Language (KQL) with Azure Data Explorer (ADX).
Why using Kusto queries ?
First of all, KQL allows you to access data more quickly than with other SIEM languages. This notion of speed makes it possible to erase the impact that system monitoring can sometimes represent.
Today, Microsoft’s internal mechanisms (Azure, 365, Sentinel, Logs Analytics, etc.) all use KQL. When working with Microsoft cloud environments, it becomes interesting to take a serious look at this technology. KQL has become the standard. Although the queries may seem a bit complex at first, they are actually quite affordable and offer excellent possibilities.
Starting to work with KQL requires a good understanding of the workflow: choosing a data source, making a filter, exporting the results.
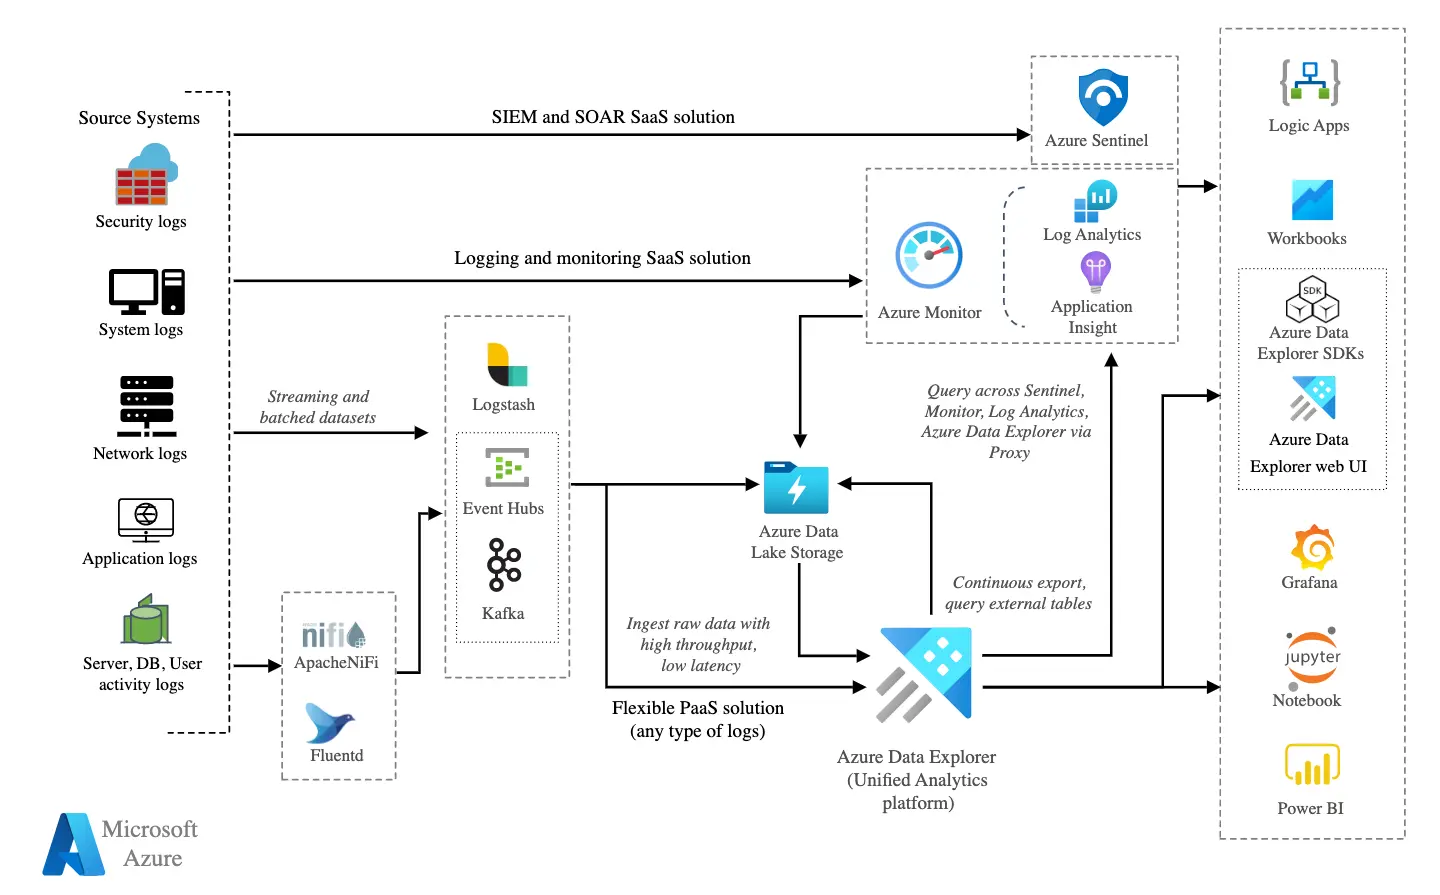
Architecture Azure logs
What can be done with Azure logs?
We can use these Kusto queries to highlight different things: discover patterns, identify anomalies and outliers, create statistical models, etc.
IaaS transversal monitoring
The first practical case that can be considered is large-scale monitoring.
Managing thresholds and alert patterns is tedious. Imagine: you have thousands of virtual servers. Wouldn’t it be simpler to write a regularly launched query listing the resources whose CPU exceeds 90% than to set an alert on each of them?
Yes, probably.
By analyzing the logs of these resources with the appropriate Kusto query, we can easily set up this type of monitoring.
What about PaaS?
Logs are less structured than for IaaS, which is normal given the diversity of resource types, each of which has different functions. The logs are not so much used for transversal monitoring as to obtain metrics that are not available anywhere else.
Write a query compatible with your monitoring tool
A matter of philosophy
To write a Kusto query that can be used by your monitoring tool, it is not only a question of format. First of all, you have to understand the nature of the data that the monitoring tool is able to ingest.
An infrastructure monitoring tool only includes very little. It usually boils down to a couple of metric name, value or unit, obtained at each check and which ends up producing time series type information. The kind of value is usually a numeric representing a quantity. It can also be a numerical value representing a state that can be converted into something understandable by humans through a formatting. Finally, it can be a string of characters that the supervision tool will be able to display or compare with an expected value or not.
And that’s about it.
So we will have to design a query able to produce data of this nature.
By example…
Web codes
Here is a first very simple example where we retrieve the metrics of a VPS every minute.
With KustoQL:
InsightsMetrics
| where TimeGenerated > ago(1m)
| project Name, Val
| project-rename channel=Name
| project-rename value=Val
| extend unit = "count"
| project channel, value, unit
Result produced by Senhub:
{
  "metrics": [
    {
      "channel": "Heartbeat",
      "value": 1,
      "unit": "count"
    },
    {
      "channel": "AvailableMB",
      "value": 4862.234375,
      "unit": "count"
    },
    {
      "channel": "UtilizationPercentage",
      "value": 4.35947904016081,
      "unit": "count"
    },
    {
      "channel": "Status",
      "value": 1,
      "unit": "count"
    },
    {
      "channel": "FreeSpacePercentage",
      "value": 82.5041931865706,
      "unit": "count"
    },
    {
      "channel": "FreeSpaceMB",
      "value": 130851,
      "unit": "count"
    },
    {
      "channel": "ReadsPerSecond",
      "value": 0,
      "unit": "count"
    },
    {
      "channel": "WritesPerSecond",
      "value": 3.89975033635857,
      "unit": "count"
    },
    {
      "channel": "TransfersPerSecond",
      "value": 3.89975033635857,
      "unit": "count"
    },
    {
      "channel": "ReadBytesPerSecond",
      "value": 0,
      "unit": "count"
    },
    {
      "channel": "WriteBytesPerSecond",
      "value": 31741.9678659914,
      "unit": "count"
    },
    {
      "channel": "BytesPerSecond",
      "value": 31741.9678659914,
      "unit": "count"
    },
    {
      "channel": "ReadBytesPerSecond",
      "value": 4851.87810796918,
      "unit": "count"
    },
    {
      "channel": "WriteBytesPerSecond",
      "value": 3432.47227674577,
      "unit": "count"
    }
  ],
  "message": "Metrics successfully retrieved.",
  "status": "OK",
  "date": 1675348657292
}

This is what it looks like in your monitoring tool:
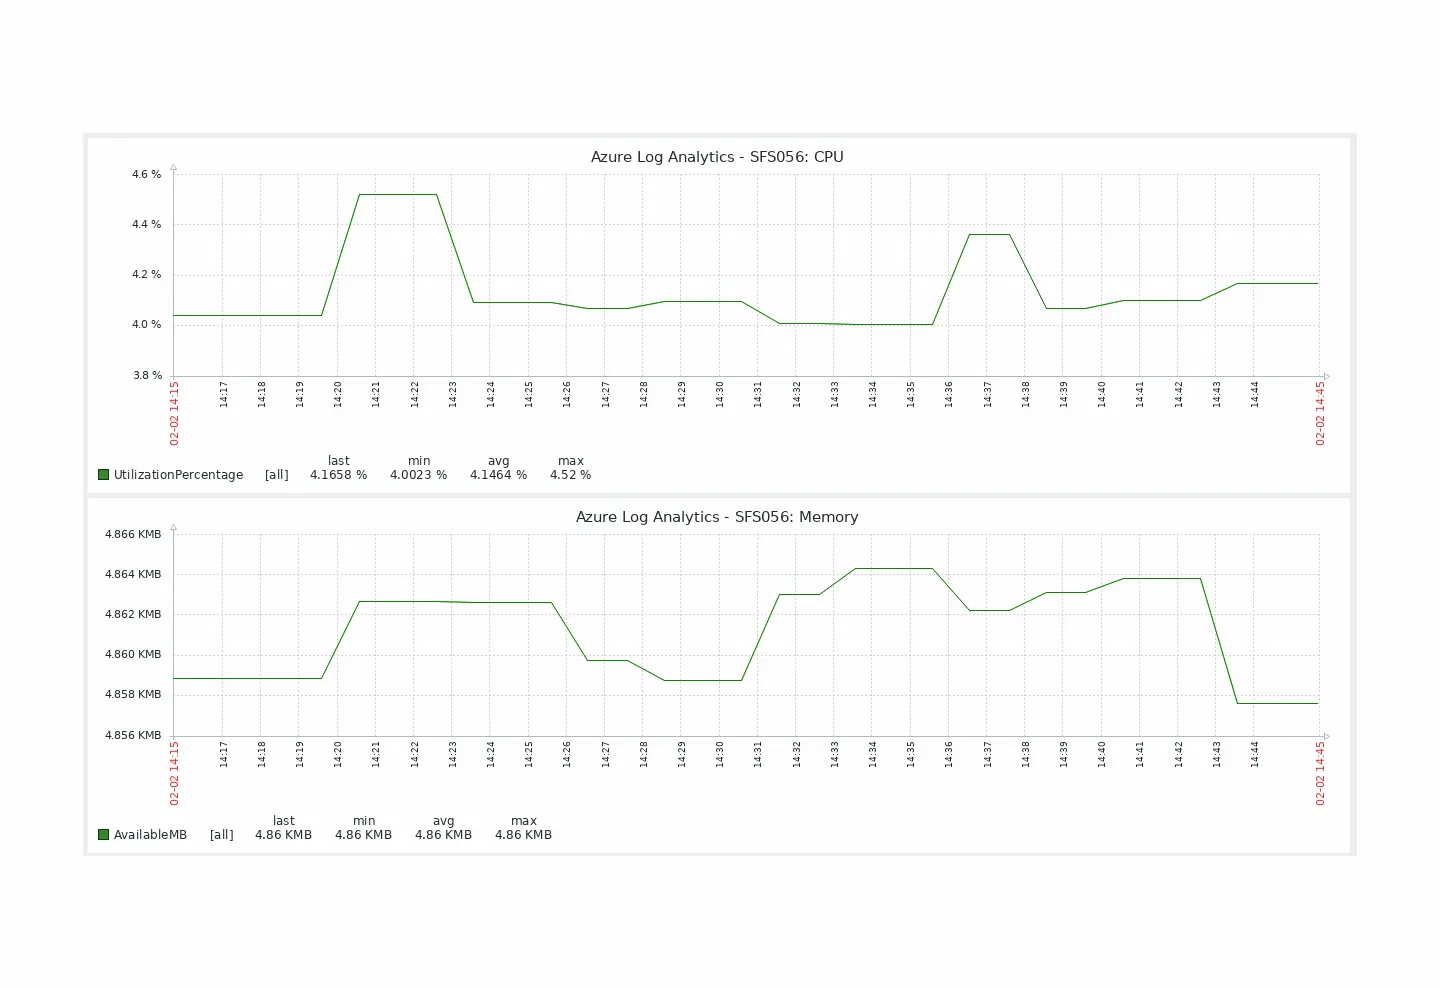
Zabbix graph rendering
Logins
We could also want to track user connections for a given period. Azure Log Analytics connects to Azure AD, so we can query the SigninLogs table. By defining the desired filters by date, time and by choosing the output, we could have a query of this type:
SigninLogs
| where TimeGenerated between (datetime(2023-01-17) .. datetime(2023-01-27))
| summarize Logins=count() by UserPrincipalName
| order by UserPrincipalName asc
By adjusting the filters a little, we could achieve this one:
SigninLogs
| where TimeGenerated between (datetime(2023-01-17) .. datetime(2023-01-27))
| where LocationDetails contains "Nantes"
| where AuthenticationRequirement =~ 'singleFactorAuthentication'
| where UserDisplayName =~ "Max Durand"
| where AppDisplayName =~ "Azure Portal"
| project UserId, UserPrincipalName, UserType, Location
Conclusion
With this connector, Senhub provides a real Swiss army knife for Azure monitoring. We are no longer limited to the metrics offered by the Azure APIs but have the ability to
- access data not available through the APIs
- arrange this information according to specific needs
- consider another way to manage its alerting on a large scale
This is just the beginning. It is already more than likely that we will improve our connector by taking into account workbooks and making standard queries available to allow you to create your monitoring even more quickly!
The Senhub in a few words
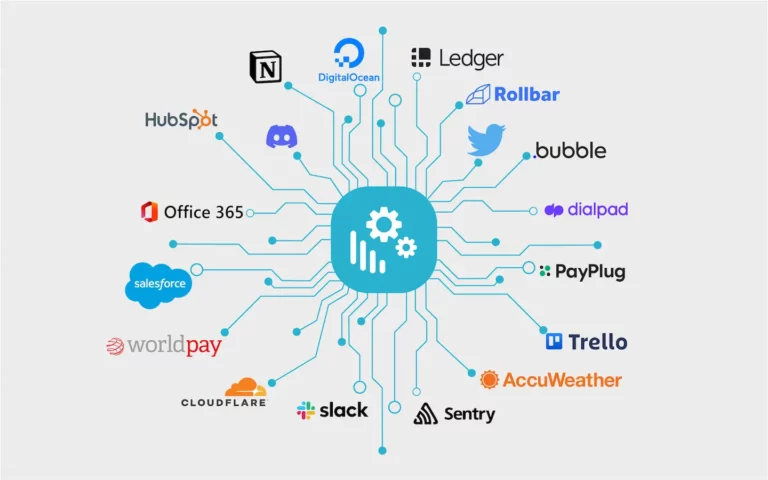
Created by IT monitoring experts for their customers, Senhub extends the capability of infrastructure monitoring tools by providing rich and powerful connectors to many cloud providers.
For more information: https://senhub.io
Newsletter
Senhub is constantly evolving. New connectors are available regularly. Keep up to date by subscribing to our newsletter.


You can have a look at Senhub,
right now
A proof of concept is worth all the big explanations. You can try Senhub now, with no commitment.
Simply create your account (no credit card required) and start monitoring your cloud assets with your very own monitoring tool.
If you have any questions, send us an e-mail at contact@senhub.io or open our chat window to talk to one of our Senhub buddies.